Decades on the Track: The Rise, Peak, and Shift of the ECI Pro Stock Tour

A line graph image used to visually represent data, and preview the article. It will be presented and analyzed in the article below.
February 10th, 2024
[Author note: Please zoom in on the images if they are too small - they will remain pretty clear when enlarged]
Introduction
The ECI Pro Stock Tour, a staple of Canadian Motorsports, has seen numerous changes since it’s inception in 2001. This article delves into an analysis of it’s driver participation over the past 22 seasons, revealing trends and shifts that have shaped the series. Covering the period from 2001 to 2023, and exploring the dynamics of driver participation, and look into the numbers. Note that I have excluded both 2020 (2 races/COVID), and 2021, which was a full campaign, but I believe COVID likely had too big of an impact to ignore.
In this article, I will only be looking at drivers who raced every race on the schedule, drivers who raced all but 1 race on the schedule, and total number of cars to participate in at least one race. I will do a separate article analyzing the average car counts throughout the Tour’s history in a future, as well as analyze the parity between drivers based on points (for example, looking at how many points separate the 1st place driver from the 5th place driver in each year’s Championship season, and how close or far the gap is). If it seems useful for correlation or insight, I can re-introduce some of the conclusions taken from this article, into the next article.
Section 1: Line Graphs & Bar Graphs
Our initial analysis, illustrated through line graphs and bar charts, reveals a trend of rising and falling driver participation. We will further analyze these trends, as we get further along, to develop a more clear picture.
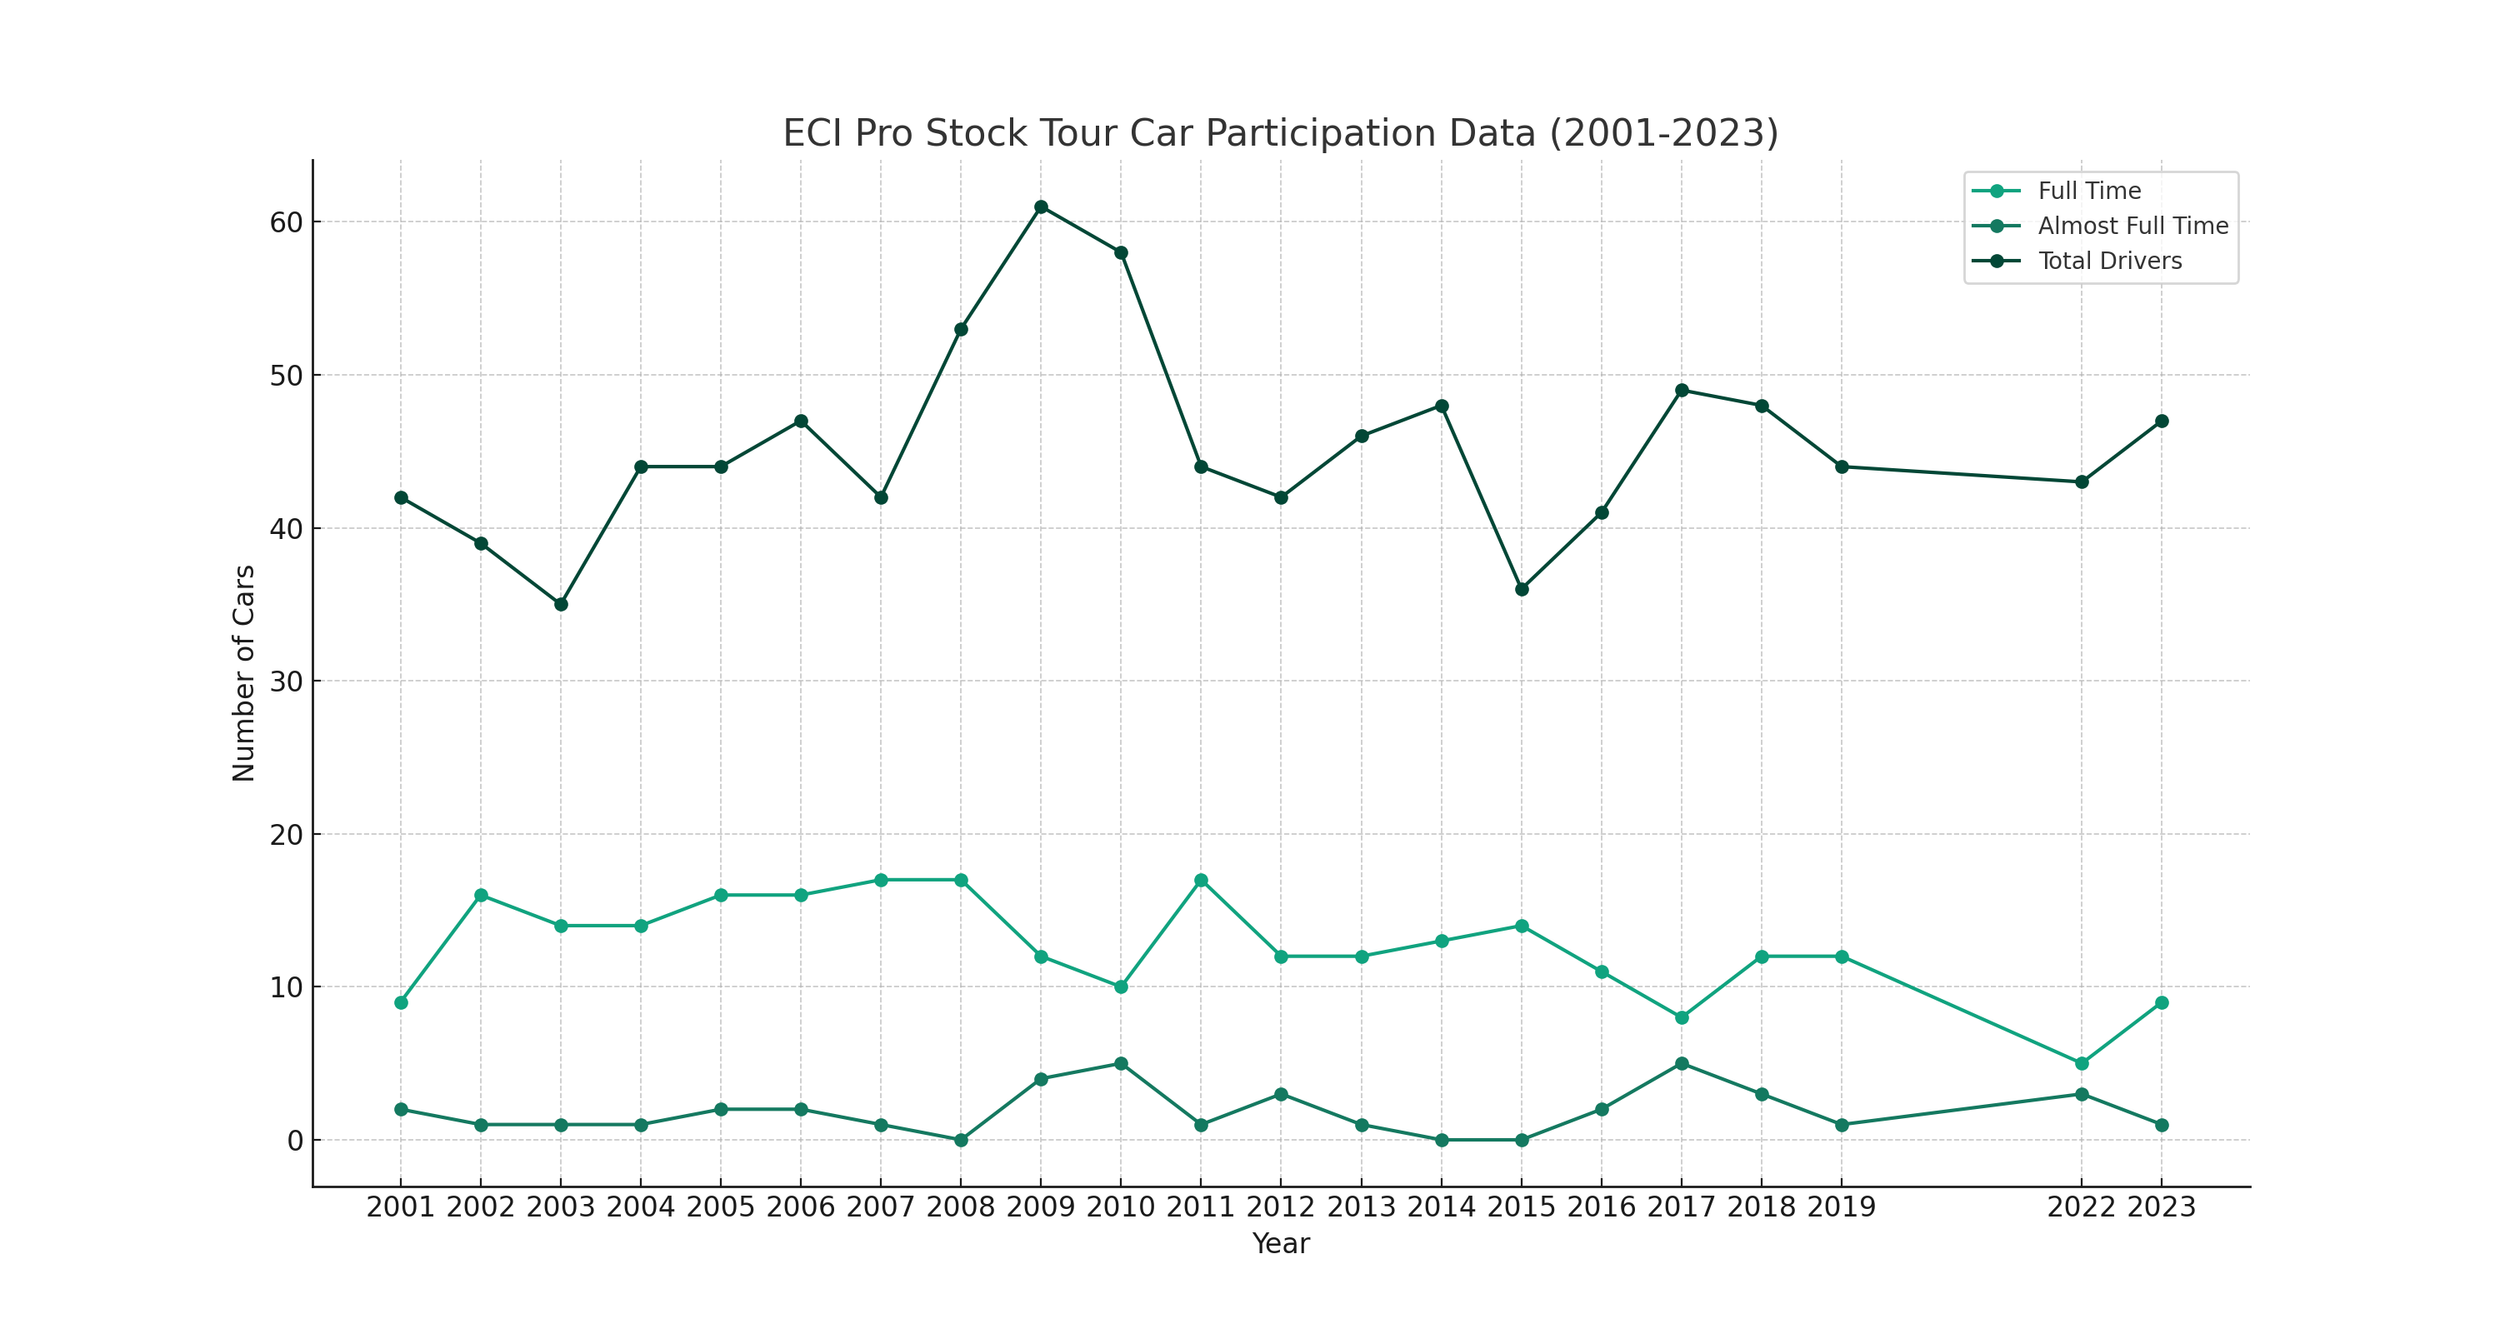
Note that “Almost Full Time” means drivers who competed in all but 1 race of the full-schedule. Drivers who for example raced 10 out of 12 races, will not be counted in this case. “Almost Full Time” is not being used as a precise term, here. Full-Time represents drivers who completed every race on the schedule, and Total Drivers represents the total number of cars that have raced at least 1 race in the season. Also, note the seeming correlation between years with lower full-time counts, having higher numbers of almost full time counts, which is not surprising.

To be clear, Combined represents all drivers who raced the full schedule, plus all drivers who every race except for 1.


Section 2: Moving Averages

This will also be expanded upon later, but note that the purpose of the Moving Averages is to pool larger sets of data together, to allow for a smoother line, to provide a bit less erratic looking of a trend over time.
Section 3: 5-Year Changes, and 10-Year Changes

To avoid confusion, treat the left side of this image, with the green, completely separately from the right side of the image, with the yellow, and only look at one at a time. The left side shows us the 3 categories, every set of 5 years (imperfect with the most recent, due to date alignment). This is to see how the totals during those period compare. The right side is done differently, this time the year is represented by the colour. The yellow line is the first decade, and the purple line is the second decade. The bottom shows the different categories, such as full time, and total drivers.
[Here is the numerical data for the 5-year comparison, for anyone interested; note that the 10-year comparison data is at the end of the next section, it will make sense why, when you get there]

Note how the lowest 5-year span for total drivers is the first half of the first decade, while the highest by far is the second half of the first decade. This insight will be useful in understanding the next section.
Section 4: Understanding Trends, and Potentially Conflicting Data - Linear Regression and Decade Comparison

Linear regression analysis is a statistical method used to model the relationship between a dependent variable and one or more independent variables. In the context of the ECI Pro Stock Tour, this is being applied to gain insight on the long-term trends in driver participation.
Full-Time Drivers: The linear regression indicated a negative trend in the number of full-time drivers, with a slope of approximately -0.289. This suggests a gradual decline in full-time participation over the years.
Combined Full-Time + Almost Full-Time: Similarly, this category also showed a negative trend with a slope of around -0.256, indicating a decrease, though less steep than in the full-time category alone.
Total Drivers: Interestingly, the total number of drivers showed a slight positive trend, with a slope of around 0.117. This indicates a slight increase in the overall number of drivers participating in at least one race per year.
Now, when we re-visit our decade-comparison, the numbers tell us a different story. They show that the total number of drivers has decreased in the second decade, whereas the linear regression analysis suggests that total number of drivers is increasing over time.
This highlights an interesting aspect of data analysis, where different methods sometimes provide seemingly contrasting insights. Not only does it highlight the importance for looking at things with multiple analytical methods to provide a more well-rounded picture, it also highlights the ability of people to deliberately use statistical methods that will bias a desired insight. The goal here is to get as realistic of an insight as possible.
Linear Regression: This method fits a straight line through all the data points and calculates the overall trend across the entire period. The slope of the line represents the average change over the years. In this case, the positive slope for total drivers suggests that there was a general upward trend when considering the entire period from 2001 to 2023. This method can be influenced by specific years where there were unusually high or low numbers of drivers, such as 2001, which was quite low, as a starting point.
Decade Comparison: This method splits the data into two distinct periods (2001-2010 and 2011-2023) and compares the averages of these periods. It can reveal changes in trends that may have occurred between the two decades. In this case, the average number of total drivers in the second decade is lower than in the first, suggesting a decrease in the more recent years. This method can provide a clearer picture of how trends might have shifted over time. The average number of total drivers being lower in the second decade suggests that, while there might have been growth in certain years, overall the more recent decade has seen a decrease in participation compared to the earlier years.
The difference can be attributed to how these methods treat data:
Linear regression considers the entire data set as a single continuous trend.
Decade comparison effectively 'resets' at the beginning of each decade, providing a separate average for each period.
The earliest years had lower participation, and there was significant growth in the middle years, followed by a decline in recent years. Such a pattern resulted in an overall upward trend in linear regression (due to the significant growth period) but a decrease in the decade comparison due to sufficiently strong recent decline. Do recall from our 5-year comparison, that the lowest total driver count was the first half of the first decade, while the highest by far was the second half of the first decade.
Also, there is room for interpretation:
This decade comparison can reveal shifts that may occur over longer periods but might not capture gradual trends as effectively as linear regression. The decrease in the average number of total drivers in the second decade might indicate a trend that wasn't consistent enough from year-to-year to significantly impact the linear regression slope.
This discrepancy underscores the importance of using multiple methods to analyze trends in data, as each method can provide different insights into the underlying patterns. It also points to the possibility of non-linear trends in the data, such as periods of growth followed by decline, or vice versa, that a linear model might not fully capture.
[Here is the numerical data, for anyone interested]
Linear Regression Analysis (Slope indicates trend direction):
Full-Time Drivers: Slope = -0.289 (indicating a decline)
Combined Full-Time + Almost Full-Time: Slope = -0.256 (indicating a decline)
Total Drivers: Slope = 0.117 (indicating growth)
Compound Annual Growth Rate (CAGR) - This was not factored into anything, I just thought I would add it for additional insight, there is no visual for this one:
Full-Time Drivers: CAGR = 0.0% (no growth)
Combined Full-Time + Almost Full-Time: CAGR = -0.475%
Total Drivers: CAGR = 0.564%
I don’t think it is important to explain exactly how CAGR works (this is most generally used when valuating companies, when investing), but for anyone interested, I will show the math:
CAGR=(End Value/Start Value) ^1/Number of Years minus 1
Decade Comparison (Averages for 2001-2010 and 2011-2023):
For 2001-2010:
Full-Time Drivers: 14.1
Combined Full-Time + Almost Full-Time: 16.0
Total Drivers: 46.5
For 2011-2023:
Full-Time Drivers: 11.36
Combined Full-Time + Almost Full-Time: 13.18
Total Drivers: 44.36
Section 5: Highest & Lowest Years
Top 3 Years for Full-Time Drivers:
2007, 2008, and 2011 with 17 full-time drivers each.
Top 3 Years for Combined Full-Time + Almost Full-Time Drivers:
2005, 2006, and 2007 with 18 drivers each (combined full-time and almost full-time).
Top 3 Years for Total Drivers:
2009 with 61 drivers.
2010 with 58 drivers.
2008 with 53 drivers.
Overall Averages (Mean Average used):
Full-Time Drivers: Approximately 12.67 drivers.
Combined Full-Time + Almost Full-Time Drivers: Approximately 14.52 drivers.
Total Drivers: Approximately 45.38 drivers.
3 Lowest Totals for Full-Time Drivers:
2022 with 5 full-time drivers.
2017 with 8 full-time drivers.
2001 with 9 full-time drivers.
3 Lowest Totals for Combined Full-Time + Almost Full-Time Drivers:
2022 with a combined total of 8 drivers.
2023 with a combined total of 10 drivers.
2001 with a combined total of 11 drivers.
3 Lowest Totals for Total Drivers:
2003 with 35 drivers in total.
2015 with 36 drivers in total.
2002 with 39 drivers in total.
Section 6: Correlation Analysis
Correlation between Total Driver Count and Full-Time Drivers: Approximately -0.153
Correlation between Total Driver Count and Combined Full-Time + Almost Full-Time Drivers: Approximately 0.097
These correlation coefficients indicate the following:
There is a slight negative correlation between the total driver count and the number of full-time drivers. This suggests that as the total driver count increases, the number of full-time drivers tends to decrease slightly, although the correlation is weak.
There is a very slight positive correlation between the total driver count and the combined category. This implies that as the total driver count increases, the number of combined full-time and almost full-time drivers also tends to increase slightly, but again, the correlation is weak.
In both cases, the correlations are not strong, indicating that there isn't a significant or consistent relationship between the total driver count and the numbers in the full-time and combined categories. This suggests that other factors might be more influential in determining the total driver count in the series.
Section 7: Overall Trends on the ECI Pro Stock Tour (2001-2023)
Full-Time Drivers:
Declining Trend: As shown by the line graph and linear regression analysis, there's a consistent decline in the number of full-time drivers. The negative slope in the regression indicates this downward trend, which is more pronounced in the second decade (2011-2023) compared to the first (2001-2010).
Moving Averages: The 3-year and 5-year moving averages further illustrate the decline, smoothing out yearly fluctuations and showing a general downward trajectory.
Combined Full-Time + Almost Full-Time Drivers:
Slight Decline: This category also exhibits a declining trend, although less steep than the full-time drivers. The line graph and linear regression confirm this gradual decrease over the years.
Moving Averages Consistency: The moving averages here also demonstrate the decline but suggest a slightly more stable participation rate compared to full-time drivers.
5-Year and Decade Comparisons for Full-Time and Combined Drivers
5-Year Comparison:
2001-2005: In the series' initial years, there was a noticeable growth in full-time driver participation, particularly starting from 2002. This period established a solid foundation for the series.
2006-2010: This time frame represents the peak era for both full-time and combined driver participation. The series witnessed its highest engagement levels, possibly due to favorable conditions or increased popularity.
2011-2015: Post-peak, there's a visible decline in participation, with numbers starting to drop off from the highs of the previous period.
2016-2023: The most recent period shows a continuation of this declining trend, with lower averages in both full-time and combined driver categories compared to earlier years.
Decade (10-Year) Comparison:
2001-2010: The first decade stands out as a period of stronger participation for both full-time and combined drivers. The averages in these categories were higher, reflecting a more robust engagement in the series.
2011-2023: Contrasting with the first decade, the second decade shows a decline in average participation for both categories. This decline could be attributed to various factors, including changes in the racing landscape, economic considerations, or shifts in the management of the series.
The 5-year and decade comparisons for full-time and combined drivers in the ECI Pro Stock Tour highlight a clear trend of initial growth and peak participation, followed by a gradual decline in more recent years. While the early years up to 2010 showed strong engagement, the post-2010 period has seen a decrease in the number of drivers committing to full-time and near-full-time participation.
Total Drivers:
Overall Trend: The total number of drivers in the ECI Pro Stock Tour shows a nuanced trend over the period from 2001 to 2023.
Linear Regression and Line Graph Analysis: While the linear regression suggests a slight growth trend in total drivers, this needs to be contextualized with other analyses for a complete understanding.
Decade Comparison:
2001-2010 vs. 2011-2023: Contrary to the linear regression's indication of slight growth, the decade comparison reveals a decline in the average total driver count in the second decade compared to the first.
5-Year Comparison:
2001-2005: Although this period had the lowest total car count, indicating a slow start for the series in the context of total cars to run at least one race, it presents a different picture for full-time driver participation. Notably, full-time driver participation grew significantly in 2002. When considering full-time drivers, these earlier years compare favourably against the more recent years, highlighting a strong initial engagement among dedicated participants.
2006-2010: There was a significant increase, marking this period as the peak in total driver participation.
Post-2010: Following this peak, there was a stabilization with levels slightly above the early years, indicating a period of relative consistency.
Moving Averages:
3-Year and 5-Year Averages: These averages help to smooth out year-to-year fluctuations. They show the initial growth, the peak in the mid to late 2000s, and a subsequent plateau with a slight overall upward trend from the early years.
The total driver count in the ECI Pro Stock Tour presents a complex picture. The series started with lower participation, peaked in the period from 2007 to 2011, and then entered a phase of stabilization, slightly above the starting levels but below the peak. While linear regression suggests a slight growth overall, the decade and 5-year comparisons provide crucial context, indicating that the peak period significantly contributed to this overall trend. The moving averages further illustrate these shifts, providing a clearer view of the long-term trends beyond the annual fluctuations.
Peak Periods and Stability:
Participation Peak: Around 2007-2011, as seen in both the line graphs and the 5-year comparison, there was a peak in participation across all categories.
Early Growth: After a low in 2001, there was a significant rise in 2002, with numbers stabilizing and peaking in the late 2000s to early 2010s, a trend that the moving averages help to illustrate.
Post-COVID:
Decline in Participation: The post-COVID era (2022/2023) shows a notable decline in participation, especially in full-time and combined drivers, a trend that is evident in the year-over-year changes and the decade comparison.
Year-over-Year Changes:
Significant Fluctuations: The year-over-year percentage changes highlight significant shifts in participation.
Summary:
The data from 2001 to 2023 shows that the ECI Pro Stock Tour experienced its highest growth and participation in the mid to late 2000s, with a peak around 2007-2011. Following this peak, there's been a general decline, particularly in full-time and combined driver participation.
Section 8: Projecting Future Growth Trends (Good & Bad Approach):


Now, this is where we run into a problem. There is qualitative analysis, which focuses on non-numeric values, and there is quantitative, which focuses on numeric data. I generated these two graphs using quantitative analysis. Consider these two graphs worthless. At most, they suggest to me that if things continued on an unrealistically consistent trend, based on these two methods, then total number of cars to race during the year (not to be confused with total car counts per race - I will do a future, separate article on that subject) will very slowly increase. As for full-time participation, it will slowly decline, however being at the level it currently is, that’s a trend that is better reversed sooner than later.
Now, the problem with this is of course, real life factors that the number trends cannot account for are what is responsible for the year to year, and longer time horizon changes alike.
Qualitative factors that may influence these trends, and questions to think about to attempt to reverse the downtrend:
Number of Rookies Entering the Series: The influx of new talent can significantly impact car counts. A surge in rookies might indicate a healthy grassroots system downstream to the premier touring series.
Number of Drivers Retiring: Veteran drivers retiring can reduce car counts, especially if not balanced by incoming drivers. The reasons for retirement, such as age, health, or personal sentiment towards the racing or series, can also provide insights. Talking to drivers to understand how they feel about things, and willingness to listen are important in this regard. Without drivers, you have no product.
Changes in Expenses: Increases in the cost of racing, like car maintenance, travel, and entry fees, can deter participation. Conversely, measures that reduce costs can attract more participants.
Changes in How the Tour is Managed: Management decisions, including race scheduling, location selection, and series promotion, can affect driver participation. Efficient and driver-friendly management is important.
Changes in Prize Money or Other Incentives: More lucrative prize money, re-configured payment structures/tiers, or incentives (like media exposure, free tire awards, etc.) can attract more competitors, and influence the decisions of those who may or may not continue racing every year, or on a full-time basis.
Changes in Sponsor Interest Levels: Sponsorship is crucial in motorsports. A decline in sponsor interest can lead to reduced funding for teams, affecting their ability to participate. Increased sponsor interest, conversely, can boost car counts.
Economic Factors: The broader macro-economic environment can impact driver participation. In economic downturns, discretionary spending on motorsports can decline.
Technological Advancements: Changes in car technology and racing equipment can influence participation. Technological barriers might deter smaller teams, while advancements can attract new participants.
Regulatory Changes: New rules or regulations, such as car specifications, points format, or qualifying procedures, can affect the number of cars able to comply, or who are interested in participation.
Series/Driver Reputation: It is important that drivers feel confident about the respect shown between competitors in the series, and the reputation created by that, can influence whether someone is willing to show up for races in their expensive equipment or not.
Competing Series and Events: The presence of competing racing series or major events can potentially split the driver pool, affecting car counts. So far, after 1 year of the Super Late Model Series running along side the ECI Pro Stock Tour, this does not seem to be the case when it comes to these two series, in any notable way.
Competition Level: The better and more exciting a field of race cars is, the larger the fan turnout, the more hype around the events, and the more driver interest. If this declines, it can risk snowballing, and if it is increasing, it can potentially keep gaining momentum.
Fan Engagement and Media Coverage (both internally from the tour, and externally via reaching out): Increased fan interest and media coverage can make a series more attractive to sponsors and drivers alike, potentially increasing car count.
Driver Development and Support Programs: Initiatives aimed at nurturing and supporting upcoming drivers, if at all economically feasible, can have a helpful role.
Cultural and Demographic Shifts: Changes in cultural interests and demographics of racing fans and potential drivers can impact participation levels over time.
Global Events: Events like the COVID-19 pandemic illustrate how external factors can drastically affect sports participation.